
Evolution of WordPress Websites
July 8, 2015WordPress Websites
January 4, 2016
Social Media Metrics
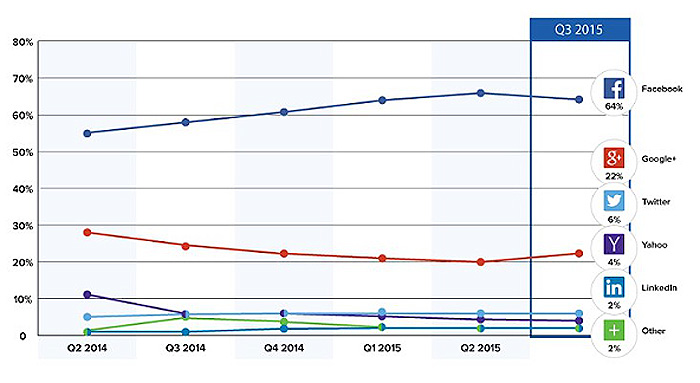
Has Facebook finally hit a plateau in number of logins?
Social Media Metrics
Facebook still dominates social media logins at 64% but as of 3rd quarter 2015, it saw a drop of 2%.
Social media is a vital part of a marketing campaign.
Need help with social media messaging and strategy?
Let RLS Group help in your social media marketing.
Call us today at 904-342-6479!
How Do Social Media Metrics Work?
As part of the effort to keep our customers informed on how their websites are doing, we have been testing all sorts of metrics. Some of these are being generated automatically by Google Analytics with some tweaking from us and others need to be calculated manually and sometimes we use a mixture of both approaches. But besides generating the data itself, there is another critical step: making sure that we interpret it correctly (this is where most people go wrong).
We decided to share what methods we use in order for you guys to take them as guidelines if you want or ignore them completely – either way this article should give you a pretty good insight into what’s out there when it comes to social media metrics. So without any further ado:
(1) What is the total number of social media fans/followers?
This is probably the single most useless metric for anyone who wants to track their business on social networks. This represents numbers, without telling you where they are coming from or what they represent. If you have a ton of Twitter followers but 90% of them don’t even look at your tweets and those that do only follow you so they can get access to your content (e.g., exclusive blog posts) then it doesn’t really mean much does it?
(2) What is the demographic breakdown of my follower base?
There are two ways to do this: firstly, using Google Analytics we were able to identify Facebook fans by using the Facebook IDs that we recorded during engagement and secondly by manually adding some of the popular social media platforms as new segments.
(3) What is the breakdown on a daily basis?
This is particularly useful in order to identify active vs. inactive days or weeks in case you don’t post frequently. This has helped us to realize that most of our fans are only active on Facebook Wednesday-Friday so this is when we decided to schedule all out promoted posts. This, compliments (4) very nicely.
(4) Where are my fans located geographically?
Google Analytics has a very nice feature where you can view the traffic sources and monitor geography, this gives you a pretty good clue on what is working and what isn’t. If your promoted posts on Facebook generate more traffic than your Twitter tweets then it could mean that either your content is better targeted to Facebook users or someone stole your Twitter password. (hint: set up two-factor authentication).
(5) How many new fans/followers do I have per day?
This might seem like an obvious one but it’s still quite useful if you want to keep track of growth over time. You will obviously get a huge spike immediately after launching a social media campaign but you will still be able to see when/if the numbers level out. This might not always be positive, for example if your promoted tweet got a lot of impressions and you only had one retweet it could mean that people aren’t responding as well as you thought they would.
(6) How many fans/followers did I lose per day?
This is very similar to (5) but instead of looking at growth we look at shrinkage. This helps us determine how popular or unpopular our social media content is: If there are more negative changes than positive ones then this could be an indication that people don’t find your stuff relevant which could mean changing something major about your approach.
(7) How many visits and conversions did my last post generate?
We implemented an event tracking code on blog posts which allowed us count how many times people visited those specific pages through each social network. The results are surprising: Facebook by far delivered the most visitors followed closely by Twitter, LinkedIn and Google+. However, only 10-15% of those were actual reads (vs. scrolling) which made us look at ways to improve that metric without compromising content quality. And yes, this includes you creating a shareable headline!
Using advanced segments in Google Analytics we can also see on what days these posts generated the most traffic and if there is a specific time when people engage more with our content through social media: generally speaking engagement seems to peak between 2pm and 5pm GMT for us but it can be different depending on your industry so make sure you test out your own numbers as well.
Using advanced segments in Google Analytics we can also see on what days these posts generated the most traffic and if there is a specific time when people engage more with our content through social media: generally speaking engagement seems to peak between 2pm and 5pm GMT for us but it can be different depending on your industry so make sure you test out your own numbers as well.